

1. 서 론
재현기간에 대한 파고 추정은 일반적인 정의에 근거하여 파고의 관점에서 재현기간을 정의할 필요가 있다. 그리고 어떤 사건 또는 사상(events)의 재현기간에 상응하는 재현 변량은 이 경우 파고가 된다. 어떤 사건의 재현기간은 단어의 의미(再現期間, return period(이하 RP), recurrence interval, recurrence time 등등)로 볼 때, 그 사건이 한번 발생하고, 이어서 다시 한번 발생하는 두 시점의 시간 간격(차이)을 의미한다. 그리고 이 재현기간 개념은 공학적인 설계, 재정·보험 등 다양한 분야에서 목표 재현기간에 대한 재현 변량(return period values; 이하 RV) 추정 방식으로 적용되고 있다. 특히 내구연한이 50~100년 정도로 매우 긴 수명을 가진 해양구조물 및 연안에 위치한 다양한 시설 등은 그 기간 동안 내습할 수 있는, 또는 내습할 것으로 예상되는, 그 확률이 높은 극한 해상상태(등) 조건에도 안정을 유지하여야 하기 때문에 재현기간 50년, 100년 정도에 대한 설계파고 추정이 중요한 문제로 자리를 잡아왔다. 그러나 최근에는 긴 재현기간에 대한 관심과 더불어 다양한 해양 발전구조물의 유지관리, 수개월 또는 수년 정도의 짧은 기간에 수행되는 해양공사의 한 부분을 차지하는 공정에 대한 파랑 환경조건, 해양시설에 대한 설계 규정(DNV, 2014, 2018; IEC, 2019) 등의 영향으로 재현기간 1년 또는 그 정도에 해당하는 짧은 재현기간에 대한 파고 추정이 중요하고 필수적인 문제로 부각되고 있는 상황이다. DNV GL(2016) 설계기준에서는 해상풍력 터빈 설계에서 재현기간 1년, 50년에 대한 극한 해상상태(extreme sea state) 조건에서의 구조 해석을 규정하고 있다. 해양에너지 설비 등의 설계에서도 발생빈도가 작은 긴 재현기간에 대한 파고보다는 보다 빈번하게 발생하는 짧은 재현기간, 주로 재현기간 1년에 대한 해양환경 조건에서의 구조해석을 요구하고 있다. 또한 수년간의 전체 해양구조물 건설공사에서 일부의 짧은 기간을 차지하는 해양(해역) 이용 공사(부품 구조물의 해양이동 시기 등)에서도 해양구조물의 내구연한이 아닌 상대적으로 아주 짧은 몇 개월에서 몇 년 정도의 해역이용 기간에 대한 설계파고 추정이 필요하다. 파고 상관분석에서도 재현기간 1개월, 1년 정도의 (극한) 파랑 자료를 이용한 연구가 수행되고 있으며, 대부분의 경우, AM(annual maxima)기법의 한계 재현기간이 1년 이상이므로 POT(peaks over threshold) 기법을 기반으로 적절한 극치분포 함수(Gumbel, Weibull-3, GEV, GP 분포함수 등)를 선정하여 추정하고 있다.
Jeong et al.(2002)은 속초항에서 관측한 약 18개월(1999.12~2001.6) 동안의 자료를 이용하여 재현기간 1/2개월, 3개월, 6개월, 12개월(1년), 2년, 3년, 5년 등의 비교적 짧은 재현기간에 대하여 파고를 추정하고, 장주기파와 단주기파의 상관분석을 수행한 바 있다. 극치해석에 사용한 자료는 하루(1일) 최대(daily maxima) 자료 517개를 이용하고, 극치분포함수는 Gumbel 분포함수를 이용하였다. Ko et al.(2020)은 장죽수도 조류발전시스템(해양에너지시스템)의 설계를 위하여 2003년부터 2019년까지 약 17년 파랑 후측자료를 이용하여 1년, 50년, 100년 재현주기에 대한 파고 추정을 수행하였으며, 분석에 사용한 함수는 Weibull-3 분포함수이다. 재현기간 1년을 포함하는 짧은 재현기간의 추정을 위하여 POT 방법으로 3.18 m 이상의 파고 236개를 대상자료로 추출하였으며, 매개변수는 PWM(probability weighted moments) 방법으로 추정하였다. 이 조건에서 재현기간 1년, 2년에 해당하는 파고를 추정한 결과는 4.05 m, 4.23 m 정도이다. Neary and Ahn (2023)은 최소 10년 이상 가용한 NOAA NDBC 부이 관측 자료를 이용하여 재현기간 50년, 5년, 1년에 해당하는 파고를 미국 연안에 대하여 추정한 바 있으며, 31년간 WAVEWATCH III 후측자료를 이용하여 모든 해양, 연안해역에서 재현기간에 대응하는 파고를 추정하여 극한파랑에 대한 Global Atlas 제작·분석 및 연안해역의 위험 평가를 수행하였다. Vitousek and Fletcher(2008)는 매년 발생하는 최대 파랑을 결정할 목적으로 GEV 분포함수를 이용하여 Hawaii 해역의 1년 재현기간을 가지는 너울(swell)을 방향에 따라 추정하였으며, 추정에 사용한 자료는 25년 동안의 부이 관측자료와 장 기파랑 후측자료이다. Battjes(1970)는 영국 연안에서 측정(visual observations & instrumental data from measurements with shipborne wave recorders)한 1~2년 정도의 관측자료를 이용하여 파랑 분포 특성을 분석하는 과정에서 극치파랑에 대한 재현기간을 1개월, 1년, 20년, 50년, 100년을 기준으로 사용한 바 있다.
따라서, 본 연구에서는 전통적으로 수행되어 온 긴 재현기간에 대한 설계파고 추정과는 달리 짧은 재현기간에 대한 설계파고 추정기법으로 극치분포함수 적합 과정을 생략하는 현장 관측자료 이용 방법을 제안한다. 이 방법은 목표 재현기간이 짧기 때문에 10년 이상의 파고자료를 사용할 수 있는 조건이라면, 극치분포함수에 대한 가정 없이도 재현기간 1년 기준으로 10개 이상의 발생 간격 정보가 도출되기 때문에, 직접 재현기간과 재현기간에 대한 파고(재현파고) 및 각각의 변수에 대한 신뢰구간을 계산할 수 있다.
그리고, 제안된 방법에 대한 추정 결과를 평가하여 현장에서의 적절한 활용을 목적으로 세부적인 결정 내용에 대한 적절한 기준을 제시한다. 더불어 재현기간 1년을 기준으로, 설계파고를 추정하는 경우, 발생할 수 있는 다양한 입력조건과 신뢰구간 추정 방법, 통계적인 관점에서 구체적인 정의가 필요한 수치에 대한 의미, 검토, 범위 제안도 포함한다.
재현기간이라는 단어는 매우 일반적인 단어이지만, 극치 해석 분야에서 가장 핵심이 되는 용어로 정의에 이용되는 단어 사용 차이는 약간 있지만, 전반적으로 동일한 개념, 정의로 간주할 수 있다. 다양한 그러나 매우 유사한 재현기간에 대한 정의를 해안공학 분야로 한정하여 정리하여 부록에 제시하였다(Appendix I 참조).
2. 관측자료 및 짧은 재현기간 파고 추정 방법
2.1 파고 관측자료
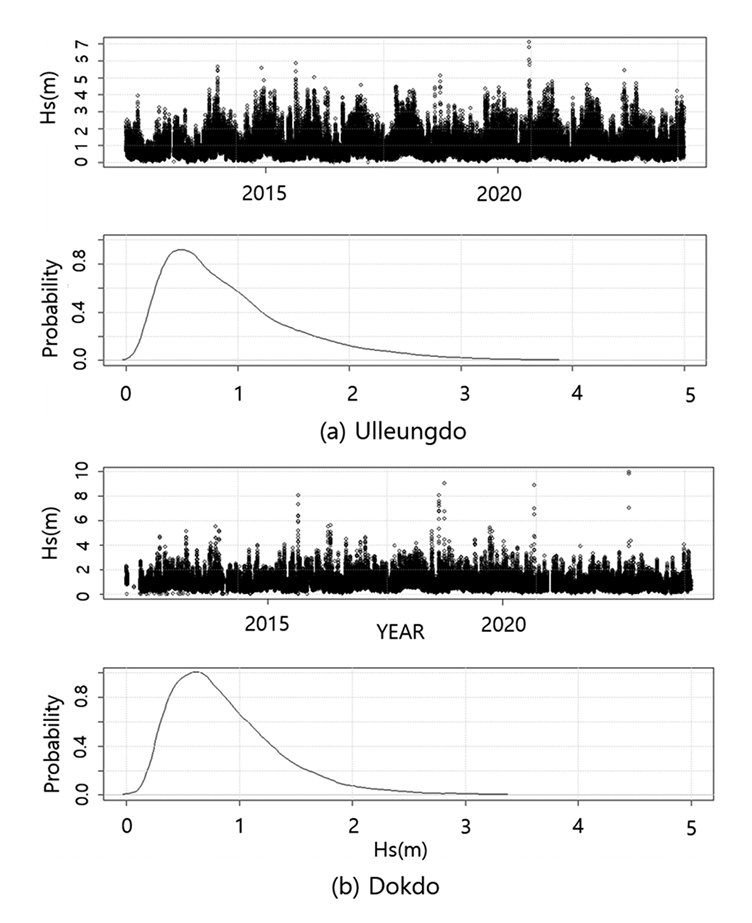
파고 관측자료는 기상청(KMA, 2024a, 2024b)에서 운영하고 있는 울릉도 해양기상부이(N 37.4554°, E 131.1144°, 수심 2,200 m, 경상북도 울릉군 저동항 동쪽 18 km 지점), 독도 파고부이(N 37.2371°, E 131.8694°, 수심 30 m, 경상북도 울릉군 독도리, 동도 남쪽 0.75 km 지점) 자료를 이용하였다. 울릉도 해양기상 부이의 파고 자료는 2012년(2011년 11월 운영 개시)부터 2023년 12월까지 자료를 이용하였으며, 독도 파고부이 자료도 2012년 자료부터 2023년까지의 자료를 이용하였다. 전체 관측기간은 12년이며, 유의파고(이하 파고) 자료의 기본 통계 측도 정보(최소파고 ≒ 0, 통계 측도에서 제외)를 추정한 결과, 울릉도, 독도 자료의 결측 비율(missing ratio)은 각각 2.9%, 8.8% 정도이며, 평균 유의파고는 각각 0.95 m, 0.90 m; 최대 유의파고는 7.05 m, 10.02 m 정도로 최대 유의파고는 큰 차이가 있으나, 평균 유의파고는 대등한 정도로 판단된다. 한편 울릉도 지점의 사분위 파고는 제1사분위, 제2사분위(median), 제3사분위 순서로 0.49 m, 0.79 m, 1.14 m; 독도 지점은 0.53 m, 0.79 m, 1.14 m 정도로 큰 차이를 보이지 않는 것으로 파악되었다. 울릉도, 독도 파고자료의 Time-Series 도시, 밀도(density) 분포 도시를 보면, 대략 1.0 m 이하 영역에 파고가 집중되어 있으며, 높은 파고 영역에서 연도에 따른 차이가 크게 드러나고 있다(Fig. 1 참조).
2.2 짧은 재현기간 파고 추정 방법
일반적으로 짧다고 여겨지는 재현기간은 1년 정도를 의미하며, 긴 재현기간은 해양공학에서 구조물 설계파고 추정에 이용되는 50년 정도로 볼 수 있다. 이 기준을 파고 자료의 관측 기간으로 보고, 재현기간 추정과 관련하여 본 연구에서는 다음과 같이 정의한다. 우리가 추정하고자 하는 재현기간을 TR, 가용한 파고 자료의 관측 기간을 TM이라고 하는 경우, TR > TM 조건을 만족하는 재현기간을 긴 재현기간이라고 하지만, 실질적으로는 TR >>TM 조건이 일반적이다. 마찬가지로 짧은 재현기간은 TR < TM 조건을 만족하는 재현기간을 짧은 재현이라고 할 수 있지만, 실질적으로는 TR << TM 조건이 일반적이다. 따라서, 대략 10~20년 정도의 관측자료가 가용한 경우, 긴 재현기간은 50~100년 정도가 되며, 짧은 재현기간은 1~2년 정도로 간주하는 것이 적절하다. 그 사이는 중간 정도의 재현기간으로 간주한다. 이론적인 추정은 가능할지라도 실질적인 (불가피한) 추정 오차 등을 고려하여 제안하는 정의로, 절대적인 정의는 아니다. Beran and Nozdryn-Plotnicki (1977)은 홍수(flood) 사상을 대상으로 짧은 재현기간(low return period)을 AM 데이터 기반 0.2~5.0년 범위로 정의한 바 있으며, Reed and Robson(1999)는 강우빈도 분석을 기준으로 매우 짧은 재현기간을 1년 이하로 정의한 바 있다. 해안공학 분야에서는 짧은 재현기간을 1년 정도로 제안한다. 반면, Feng et al.(2021)은 구조물 설계의 관점에서 재현기간 50년을 기준으로 50년 이하는 작은(small) 재현기간, 50년 이상은 큰(large) 재현기간으로 구분하였다.
본 연구에서는 10년 이상의 관측자료가 가용한 울릉도, 독도 파고 자료를 이용한 1년 정도의 짧은 재현기간에 대한 파고 추정을 대상으로 수행한다. 본 연구에서 제안하는 방법은 후보 극치함수에 대한 적합 과정이 없는 분포 무관(distribution free) 방법으로는 유사하지만, 추정방식이 약간 차이가 있는 격차(grid) 탐색 기법과 양분(bi-section) 추정 방법을 제안한다. 어떤 기준 파고에 대한 재현기간 추정은 기준 파고(threshold) 보다 큰 파고가 발생하는 빈도(회수, 개수)를 계수(count)하고, 전체 자료로 나누어 평균 재현기간을 계산하는 아주 간단한 개념이다. 본 연구에서는 재현기간이 확률변수이기 때문에, 평균 재현기간이라는 하나의 대표 추정(point estimate)과 더불어 신뢰구간 90%(±5%) 수준에서 상한, 하한을 추정하는 구간추정도 포함한다. 구간추정은 기준 파고(재현기간에 해당하는 파고, 재현파고), 재현기간의 신뢰구간을 모두 포함한다. 각각의 방법을 이용한 추정 개념과 절차는 다음과 같다. 여기서, 파고자료는 H(ti) = Hi(i = 1, 2, …, n, n = 전체 관측자료의 개수)이다.
(1) 격자(구간) 탐색 기법
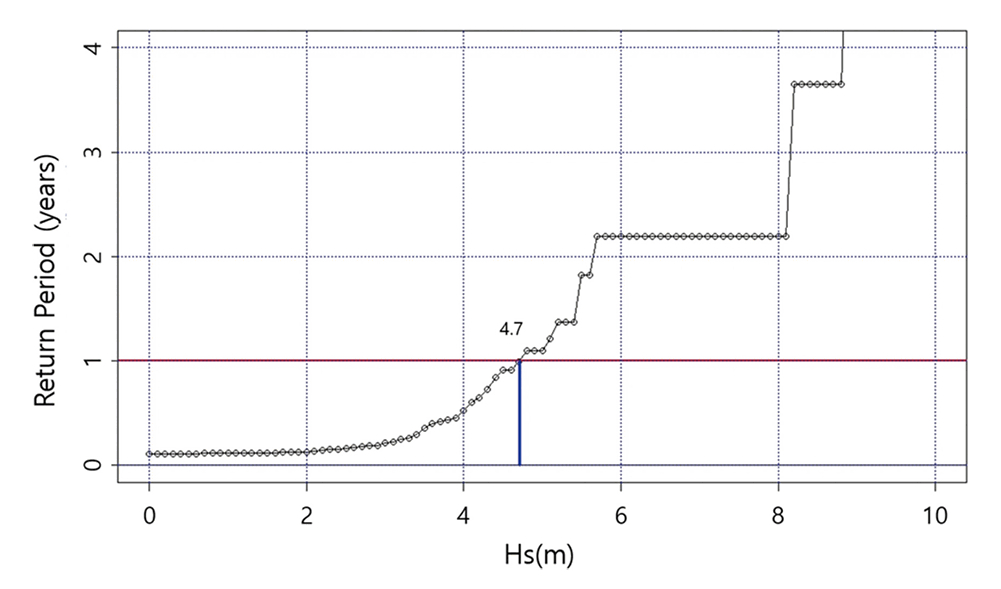
이 방법은 매우 간단한 탐색 방법으로 전체 파고의 범위([min(Hi), max(Hi)] 또는 [0, max(Hi)])에서 일정 간격(ΔH, 보통 0.1, 0.01 m 간격 정도)으로 다수의 파고 자료 집합(Hk = min(Hi) + k·ΔH, k = 0, 1, 2, …, m; 여기서 m = [max(Hi) - min(Hi)]/ΔH)을 구성하고, 각각의 파고를 기준 파고로 설정한 조건에서, 그 기준 파고(Hk)를 상회하는 파고 발생빈도(개수, n(Hk))를 계산하고, 그 개수를 전체 기간으로 나누어서 재현기간(RP(Hk), 단위는 연도)을 계산하면, 다음과 같은 자료 세트(Hk, RP(Hk))를 얻을 수 있다. 이 자료 세트를 이용하여 추정하고자 하는 재현기간을 찾고, 그에 대응하는 파고를 선택하면 된다(Fig. 2 참조 - 예시 재현기간 1년). 목표 재현기간에 정확하게 대응하는 파고 자료가 없는 경우에는, 목표 재현기간에 인접한 미만, 초과 재현기간의 파고 정보를 이용하여 목표 재현기간에 대한 파고를 내삽하여 추정하면 된다. 이 방법을 수행하는 코드(R script)는 부록에 첨부한다(Appendix II 참조).
(2) 양분(bi-section) 추정 기법
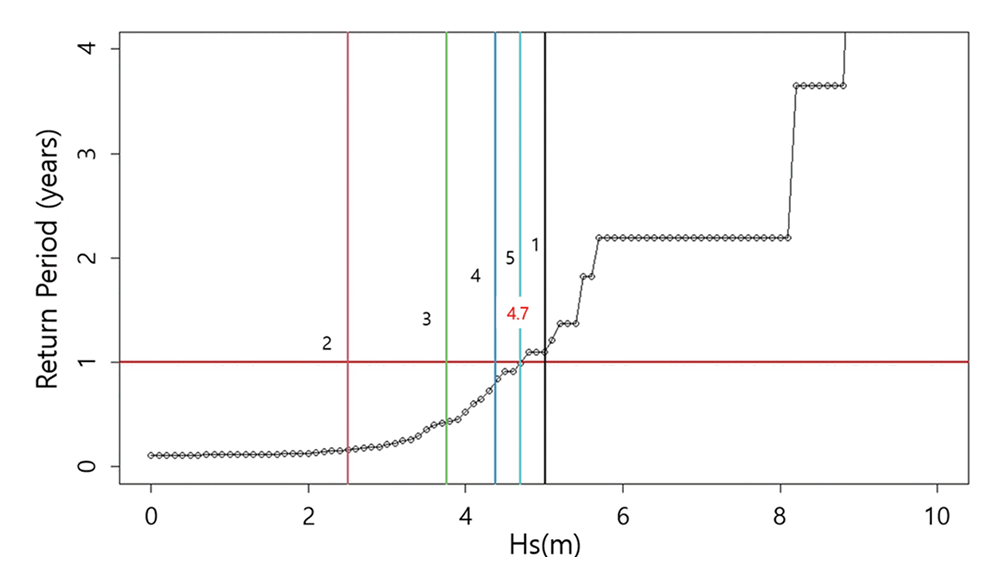
격자 구간 탐색 기법은 일정 간격으로 배열되는 다수의 모든 파고 구간에서 평균 재현기간을 탐색하는 기법으로 하나의 목표 재현기간에 대한 추정 조건에서는 불필요한 계산이 과도하게 발생한다. 반면 양분 방법은 하나의 목표 재현기간에 대한 기준파고(HR)를 추정하는 방법이다. 이 방법은 전체 파고 구간(범위)에서 탐색 범위를 초기조건에서 절반(1/2) 비율로 점차 줄여나가며 추정하는 방법으로, 초기 탐색 파고 기준을 [max(Hi) + min(Hi)]/2 파고에서 시작하면, 파고 범위 10 m 조건에서 대략 10회 반복 계산 수행으로 0.01 m 정도(precision)로 주어진 재현기간(TR = T(HR))에 대한 파고 추정이 보장된다. 아래 그림은 양분 방법으로 독도 파고 자료를 이용하여 재현기간 1년에 해당하는 재현 파고를 추정하는 단계를 표현한 그림이다(Fig. 3 참조).
이상의 방법에서 얻어지는 기준파고(HR)를 초과하는 다수의 파고 발생 시점 자료(τ1, τ2, …, τm)를 이용하여 재현기간과 그에 대응하는 파고의 신뢰구간을 추정하는 수식은 표본의 개수가 작기 때문에 Student-t 분포를 이용하여 추정하고, 그 수식은 다음과 같으며, 이상의 추정을 수행하는 코드(R script)는 부록을 참고한다(Appendix II 참조).
- 파고 발생 시점의 간격 자료로 변환, {τ2 - τ1, τ3 - τ2, …, τm - τm-1, τ1 + (Tm - τm)} = {Δτ1, Δτ2, …, Δτm-1, Δτm}
- 재현기간, T R = E △ τ = △ τ ¯ = 1 m ∑ k = 1 m △ τ k
- 재현기간 변수의 표준편차, σ(Δτ); 유의수준 α = 0.05
재현기간에 대한 신뢰구간: △ τ ¯ - t a - α , m - 1 · σ △ τ m - 1 ≤ T R ≤ △ τ ¯ + t 1 - α , m - 1 · σ △ τ m - 1
재현기간의 구간이 추정되면, 상한, 하한 재현기간에 대한 기준파고를 추정하고, 그 기준파고를 목표 재현기간에 대한 기준 파고의 상한, 하한 구간으로 간주한다.
3. 재현기간 추정 결과 및 토의
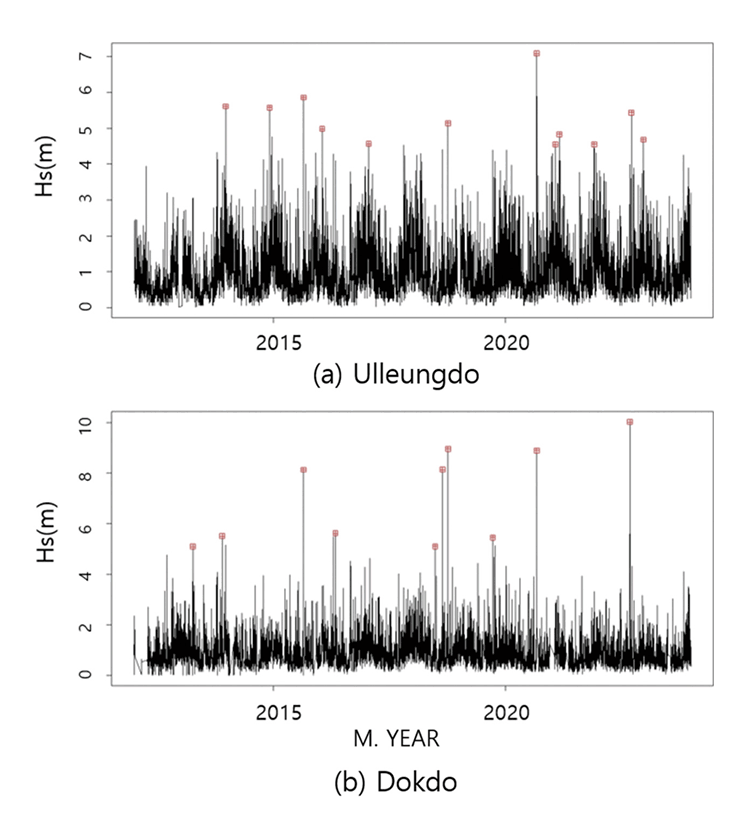
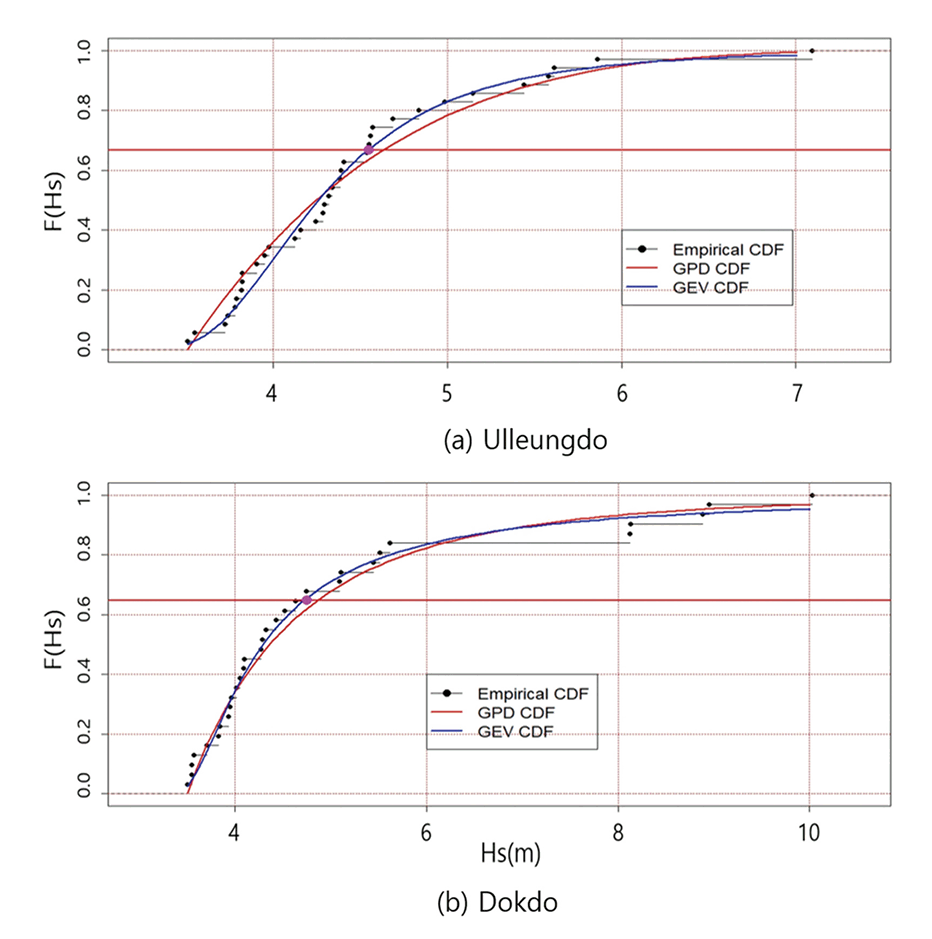
본 연구에서 제안한 방법과 울릉도, 독도 파고 자료를 이용하여 재현기간 1년을 기준으로 반년(1/2년), 2년을 추가하여 재현기간을 추정하였다. 또한 전통적인 극치해석기법 결과와 비교하기 위하여 대표적인 극치분포함수로 널리 이용되는 GP, GEV 분포함수를 선택하여 동일한 재현기간에 대응하는 파고를 추정하였다. 극치분포함수의 매개변수 최적 추정은 R {eva} 패키지(Bader and Yan, 2020)에서 제공하는 gpdFit(), gevrFit() 함수를 이용하였으며, 짧은 재현기간의 추정에도 작동할 수 있도록 POT 기준 파고(threshold)는 3.0 m 조건을 적용하여 극치분석 대상 파고 자료로 이용하였다. 기준 파고를 상회하는 파고 자료는 {pracma} 패키지(Brochers, 2023)에서 제공하는 함수 findpeaks() 함수(MATLAB 함수와 동일)를 이용하였으며, 이 함수의 minpeakdistance 옵션을 이용하여 인접한 기간의 파고, 상관이 있을 것으로 간주되는 기준 파고를 상회하는 파고 자료의 선택을 제한하였다. 일반적으로 파고가 상관을 가지는 2~3 정도 기간을 설정하는 것이 적당하지만, 재현기간을 고려하는 경우에는 영역 최대(block maxima) 자료 추출 개념을 고려하여 수개월 단위로 지정하는 것도 가능하다. 독립적인 자료라 할지라도 특정 시기(계절)에 고파가 집중되는 경우에는 재현기간의 편차가 매우 커지는 경우가 발생하기 때문에 과도하고 비현실적인 구간 추정 결과가 도출되기도 한다. 이 문제를 방지하기 위한 방법으로는 최소첨두(상관)거리, minpeakdistance 수치를 계절 단위 정도로 지정하면 된다. 본 연구에서는 minpeakdistance = 720, 대략 한달 정도의 자료 개수에 해당하는 수치를 지정하였다. 한편 현장 관측에서 빈번하게 발생하는 결측에 대한 고려는 전체 자료기간에서 가용한 자료기간을 고려하여 보정하는 방식을 선택하였다. 결측구간이 전체 자료에서 큰 편향(bias)을 발생시킬 우려가 적다고 판단하는 경우에는 결측기 간을 제외한 기간을 전체 파고 자료 기간으로 조정한다. 울릉도의 경우, 전체 자료 기간이 12년이지만, 결측 비율을 고려하여 11.65년으로 조정하여 재현기간 추정에 이용하였다. 예시로 재현기간 1년 조건에 상응하는 파고와 발생시점을 표시한 그림(Fig. 4 참조)과 그 자료를 이용하여 경험 누적분포함수 기준, GP, GEV 분포함수에 적합된 누적분포함수 그림을 보면, 적합 수준이 높게 나타나고 있는 것으로 파악된다(Fig. 5 참조). GP, GEV 분포 함수 등 극치분포함수를 이용하는 경우에는 그 함수의 적합여부에 대한 통계적인 검정(goodness-of-fit test) 절차가 필요하지만, 본 연구에서 제안한 방법은 자료의 분포함수에 대한 가정이 없기 때문에 직접 적용이 가능한 장점이 있다.
4. 추정 결과에 대한 고찰
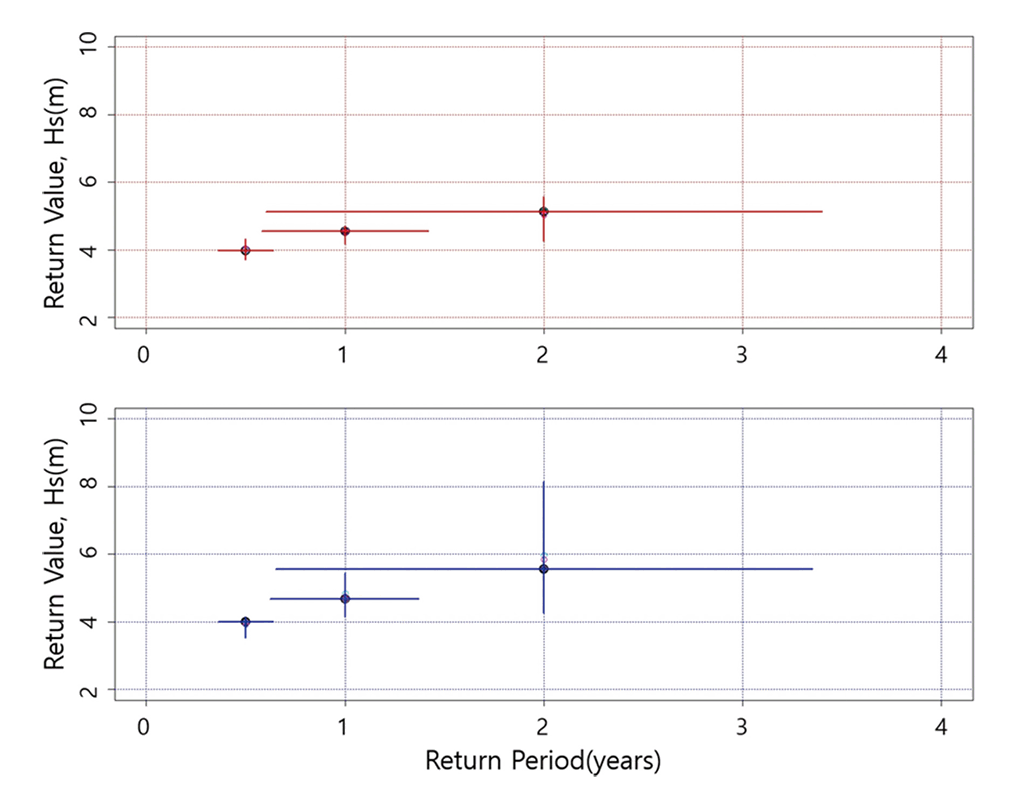
재현기간 2, 1, 1/2년에 대한 파고를 추정하고, 그 결과를 기존의 전통적인 극치해석 기법으로 추정한 수치와 비교하였다. 각각의 방법으로 추정한 결과에서 보이는 차이는 통계적으로 유의미한 정도는 아닌 것으로 파악되었다. 그러나 본 연구에서 제안한 방법은 어떤 후보 극치 분포의 가정, 그로 인한 매개변수 추정 과정이 생략되기 때문에 추정이 간단하다. 그리고 격자 탐색기법, 양분 추정기법 모두 ±0.1 이하의 미미한 수준의 차이로 추정 결과가 동일하다고 간주할 수 있다. 재현기간이 1년에 대응하는 파고 추정은 12년 이상의 관측 자료를 이용하는 경우, 기준파고를 초과하는 파고 사상의 발생 간격 변수(자료)가 10개 이상 생성되기 때문에 평균 재현 기간 추정의 신뢰구간은 0.6~1.4년 정도이고, 그에 해당하는 추정 파고의 신뢰구간 크기는 울릉도 0.6 m, 독도 1.3 m 정도로 큰 차이를 보이고 있음을 알 수 있다. 이 구간은 재현 기간 2년 조건에서 울릉도, 독도 각각 1.3 m, 3.9 m 정도로 독도에서 매우 크게 나타나고 있음을 알 수 있다. 이는 재현 기간의 증가로 인한 파고 사상의 발생 건수가 5~6개 정도로 줄어들기 때문으로 판단된다. 이는 재현기간이 반년(1/2년)인 경우, 0.60 m, 0.62 m 정도로 오차구간의 크기가 대폭 감소하는 정도로 입증된다(Table 1, Fig. 6 참조).
한편 재현기간이 1년 이내인 경우에는, 극치해석 및 본 연구에서 제안한 방법 등으로 반년, 3개월, 1개월 정도의 재현기간에 대한 파고 추정도 가능하지만, 우리나라 파고 자료의 경우, 전반적으로 계절적인 변화 양상, 겨울에 높은 파고, 여름에 낮은 파고 변화 양상을 보이는 영향을 고려할 필요가 있다. 그러나 이는 평균적인 변화 양상으로 짧은 기간이라 할지라도 특정 기간 특정 기간에서의 극값을 대상으로 추정하기 때문에 그 영향 반영이 미미하거나 증폭되는 경우가 발생할 수 있다. 따라서 재현기간이 아주 짧은 계절 규모, 월 또는 그 이하의 규모로 파고를 추정할 경우에는 그 기간의 (극치) 파랑 특성을 분석하여 보정하는 과정이 필요할 수도 있을 것으로 판단된다.
장기 파랑관측자료가 부재한 경우 또는 널리 이용되는 AM (annual maxima) 자료만이 가용한 경우에는, 이론적으로는 재현기간 1년 빈도 추정이 곤란하지만, 다음과 같이, 홍수(flooding) 빈도분석에서 이용되는 AM, POT 재현기간 관계 공식을 이용하여 추정할 수도 있다(Langbein’s equation; Beran and Nozdryn-Plotnicki, 1977).
실질적으로 재현기간 1년 추정을 위해서는 POT 방법이 불가피하지만, AM 자료를 이용하는 경우에는 재현기간 1.58년을 기준으로 추정하고, 그 추정파고를 재현기간 1년으로 간주하는 방식이다. 이 방법은 이론적으로 AM 파고자료를 이용하는 경우, 극한에 해당하는 재현기간 1년 파고는 AM 자료의 최소가 해당되지만, 실질적으로는 과도하게 작은 수치로 간주되는 문제를 해결할 수 있다.
5. 결론 및 제언
본 연구에서는 짧은 재현기간을 가지는 파고 추정 기법을 제안하였다. 이 방법은 재현기간 1년 규모의 파고를 10년 이상의 자료를 활용하여 추정하는 방법이다. 이 방법으로 울릉도, 독도에서 관측한 12년 정도의 파고 자료를 이용하여 추정하였으며, 추정 파고는 각각 4.55 m, 4.67 m 정도로 추정되었으며, Student-t 분포를 이용하여 추정한 재현기간 1년 파고의 신뢰구간은 각각 [4.18, 4.69], [4.14, 5.43] 범위로 파악되었다. 본 연구에서 제안한 방법을 전통적인 극치해석 기법을 이용하여 추정한 수치와 비교한 결과, 통계적으로 유의미한 수준의 차이는 보이지 않는 것으로 파악되었다. 따라서 본 연구에서 제안한 방법을 이용하여 다양한 설계기준에서 검토 기준으로 제시되는 재현기간 1년 또는 그 정도의 재현기간을 가지는 파고 추정에 신속하고, 간단하게 활용할 수 있을 것으로 판단된다.