Sediment Transport Calculation Considering Cohesive Effects and Its Application to Wave-Induced Topographic Change
점착력을 고려한 표사유동 수치모델의 제안과 파랑에 의한 지형변동의 적용성 검토
Article information
Abstract
A sediment transport calculation considering cohesive force is proposed to deal with the transport phenomena of cohesive sediment. In the proposed calculation, each sand particle is assumed to be surrounded by a thin layer of mud. The critical Shields parameter and bed-load sediment transport rate are modified to include the cohesive force acting on the sand particle. The proposed calculation is incorporated into a two-way coupled fluidstructure-sediment interaction model, and applied to wave-induced topographic change of artificial shallows. Numerical results show that an increase in the content ratio of the mud, cohesive resistance force per unit surface area and water content cause increases in the critical Shields parameter and decreases in the bed-load sediment transport rate, reducing the topographic change of the shallow without changing its trend. This suggests that mixing mud in the pores of the sand particles can reduce the topographic change of shallows.
Trans Abstract
점착성 표사의 유동 특성을 다루기 위하여 점착력을 고려한 표사유동 수치계산 모델이 제안되었다. 제안된 계산 모델에서는, 각각의 모래 입자는 점토의 얇은 층으로 둘러싸여 있는 상태를 가정했다. 모래 입자에 작용하는 점착력을 적용하기 위해 한계 Shields수와 소류사량을 결정하는 항이 수정되었다. 제안된 표사모델은 3차원 유체·구조·지형변화 연성 수치계산 모델에 적용하여, 인공여울의 지형변화특성을 파악하였다. 수치계산 결과, 각각의 점토 함유율, 단위면적당 작용하는 점착 저항력, 함수비의 증가는 한계 Shields수를 증가 시키고, 반대로 소류사량을 감소시킴으로써 지형변화 경향에는 영향을 미치지 않은 채 여울의 지형변화를 억제하는 것으로 나타났다. 점토를 모래 입자와 혼합함으로써 여울의 지형변화를 감소시킬 수 있는 것을 암시한다.
1. Introduction
Dredging is a periodically required activity in coastal and fluvial regions with the purpose of maintaining sea routes, environment protection and reservoir capacity. River channel and harbor dredging produces millions of tons of soil annually. Managing these enormous amounts of dredged soil remains an unsolved problem. One of the proposed methods of handling dredged soil is to create artificial shallows in a nearby bay. From an environment perspective, it was confirmed that there are beneficial effects such as increasing bottom life and enhancing water purification capacity (Kazama et al., 2006). In contrast, the stability of artificial shallows composed of dredged soil against incident waves is of concern because of the low weight of fine sediments in the dredged soil. Nakamura et al. (2012a, 2012b) conducted experimental and numerical research on the characteristics of the topographic change of shallows comprised of fine sand. However, these studies had limitations because they only considered non-cohesive fine sand, whereas actual dredged soil contains fine sediments with cohesive forces. Thus, there is little understanding of the characteristic of cohesive fine sediment transport and the topographic change of artificial shallows made up of dredged soil.
Most research on sediment transport phenomena has been based on non-cohesive sediments and there is little research that accounts for the effects of cohesive forces besides Son and Hsu (2008). Ashida et al. (1982) proposed a formula concerning the non-dimensional critical shear stress and the nonequilibrium sediment transport of the sand particles. This formula considered the effects of the fine sediments (hereinafter called mud) with cohesive force existing in the pore space of the sand particles and confirmed the validity of the formula through comparison with experimental tests. However, there was no attempt to apply the formula to wave fields, which is a more energetic environment, to analyze the characteristics of sediment transport covering the cohesive effects in mixed soil coexisting with sand and mud such as dredged soil or the real sea bottom. Consequently, the characteristics of sediment transport in mixed soil are not fully understood.
In this study, a sediment transport calculation considering the cohesive effects induced by mud in the pores of sand particles is proposed and the basic characteristics of the calculation are investigated taking into account the correlation between cohesive intensity and the bed-load sediment transport rate. In addition, the calculation is incorporated into a three-dimensional coupled fluid-structure-sediment interaction model (FSSM) developed by Nakamura et al. (2011), which can analyze the interaction between waves and topographic change, and applied to the condition of hydraulic experiments on the topographic change of shallows composed of fine sand (Nakamura et al., 2012a). Furthermore, a sensitivity analysis of the modified model is carried out in terms of the effects of cohesive force on the topographic change of the shallow, which comprises a soil mixture based on the assumption that mud exists in the pores of the sand particles.
2. Sediment Transport Calculation Considering Cohesive Effects
Sediment transport calculation considering the effects induced by mud contained in the pores of the sand particle is proposed following Ashida et al. (1982). Mud is defined as silts and muds having cohesive characteristics in this paper. Specifically, the critical Shields parameter τ*c and bed-load sediment transport rate qi are modified to consider the cohesive effects of the mud.
Ashida et al. (1982) considered the soil mixture combined with spherical sand particles with uniform particle diameter d50 and mud filling in the pores of the sand particles as bottom sediment. It was assumed that the friction between the sand particles did not change even for the condition without mud. That is, even though the mud is eliminated, sand particles can maintain a static stable state. Thus, we now have the mud-induced cohesive force FC expressed by:

in which k1′d250 is the cohesive area of the mud contributing to the cohesive resistance and fc is the cohesive resistance force of the mud per unit surface area. Here, assuming the cohesive area per contact point between sand particles is a, it can be obtained approximately from a simple geometric relationship as in Ashida et al. (1982). When one sand particle is supported by the number of contact points, n, this can be given byk1′d250 = an, and finally, Eq. (1) can be expressed as:
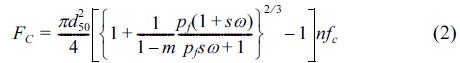
in which m is the porosity; pf is the content ratio of the mud; ω is the water content; and s is the specific weight of the sand particle (= ρs/ρw, where ρs is the sand particle density and ρw is the water density). Additionally, there are the submerged weight of the particle, W, and the drag and lift forces, FD and FL, which are triggered by the bottom velocity. The forces acting on the sand particles, a part from the cohesive force FC expressed in Eq. (2), are expressed by:
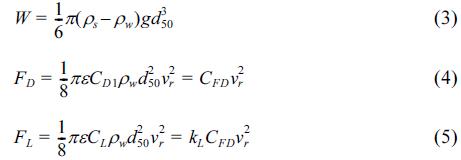
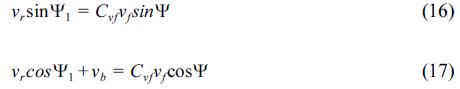
in which g is the gravitational acceleration; ε is the shading coefficient; CD1 and CL are the turbulent drag and lift coefficients; kL is the ratio between CD1 and CL (= CL/CD1); vr is the relative flow velocity acting on the particle for the mean transport velocity vb of a sediment particle in bed-load motion; and CFD = πεCD1ρwd502/8. In the following, τ*c and qi are derived by incorporating the effects of FC.
2.1 Critical Shields Parameter
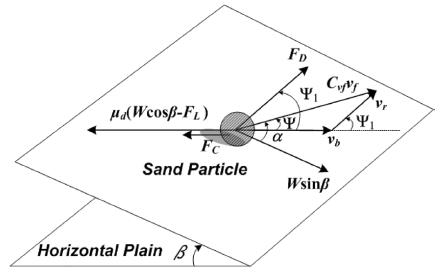
In the critical state, the force acting on a sand particle exists as shown in Fig. 1. Here, vf is the friction velocity; Cvf is the coefficient of the friction velocity; a is the angle between the flow velocity Cvfvf and the direction of the steepest bed slope; Ψ is the angle between the flow velocity Cvfvf and the sediment transport velocity vb; and Ψ1 is the angle between the relative flow velocity vr and the sediment transport velocity vb. The values FDC, FLC, vfc, vbc, vrc, αc, Ψc and Ψ1c represent those of FD, FL, vf, vb, vr, α, Ψ and Ψ1 in the critical state. In addition, β is the angle of the steepest bed slope and μs is the static friction coefficient of the sand particle. In this case, vbc = 0, which means that vrc = Cvfvfc and Ψc = Ψ1c, because it is under the critical state. The formulations of Ψc and vrc2 are given as follows from the force balance in the directions the same as and perpendicular to vbc:
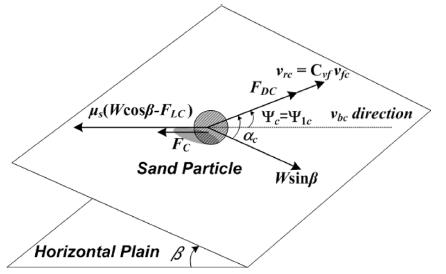
Force balance on a sediment particle on a sloping bed in the critical state.
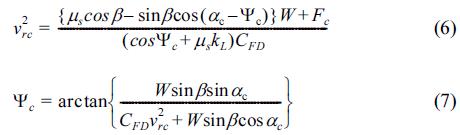
In Eq. (7), Ψc and ac have the same sign and |Ψc| ≤ |ac|. Here, the unknown parameters, vrc2 and Ψc, are determined by iterative calculations. Defining τ*c0 as a critical Shields parameter in the horizontal plane (b = 0) without considering the cohesive force (FC = 0), τ*c can be written by the following equation:
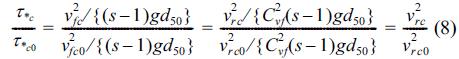
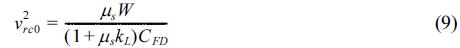
in which v2rc0 and v2fc0 are v2rc and v2fc in the horizontal plane (b = 0) without the cohesive force (FC = 0), and v2rc0 is obtained as follows from substituting FC = β = Ψc = Ψ1c = 0 into Eq. (6):
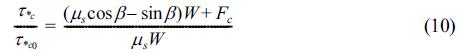
Furthermore, for the cross-sectional two-dimensional phenomenon, the following equation is obtained because of
αc = Ψc = Ψ1c = 0:
In addition, the influence of the cohesive force is considered to be a pickup function of suspended sediment through the value of the critical Shields parameter τ*c.
2.2 Bed-Load Sediment Transport Rate
The bed-load sediment transport rate qi per unit width and unit time is defined as follows (Engelund and Fredsøe, 1976):

where pEF is the percentage of sediment particles in bedload motion in the surface layer of the bed, which is expressed as:
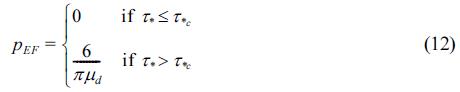
in which μd is the dynamic friction coefficient (μd ≤ μs) and τ* is the Shields parameter, which is defined as:
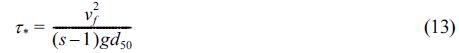
Fig. 2 shows the agitating and stabilizing forces acting on a sand particle in the bed-load motion. The equation of motion in the same direction as the sand particle movement (i.e., the direction of vb) is given as:
Force balance on a moving sediment particle on a sloping bed.

In the same way, the equation of motion in the direction perpendicular to the sand particle movement is:

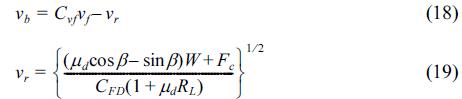
In addition, the simple geometric relationship between vb, Cvfvf and vr gives:
Here, there are four unknown variables (i.e., vb, vr, Ψ and Ψ1) and four equations, and vbi is computed through iterative calculations. Thus, the bed-load sediment transport rate qi is given by Eqs. (11) and (12) together with τ*c0, which is obtained in the previous section. Furthermore, for the crosssectional two-dimensional phenomenon, the equation is summarized as follows from the relationship of α = Ψ = Ψ1 = 0:
3. Characteristics of Sediment Transport Calculation Considering Cohesive Effects
In this section, the fundamental characteristics of the proposed sediment transport calculation are investigated based on Eqs. (10), (18) and (19) for a cross-sectional two-dimensional condition, for which there is no need to perform any iterative calculation. Specifically, sand particles with d50 = 0.1 mm, ρs =2.65 × 10³kg/m3 and τ*c0 = 0.03 were assumed to be on the horizontal plane (β=0o). The three cases for the water content ω (0.2, 0.5 and 0.8), two cases for the content ratio of the mud pf (0.05 and 0.20) and three cases for the cohesive force per unit surface area fc (0.1, 0.5 and 1.0 N/m2) were then used as the main variables. The calculation without the cohesive force effect (fc =0.0N/m2) was also carried out for comparative analysis. Other parameters were g=9.80m/s2, ρw =9.97×10²kg/m3, CD1 =0.45, Cvf =10.0, kL =0.85, ε = 0.4, μs = 0.63 and μd =0.51, which are the same as used in Nakamura et al. (2011).
Fig. 3 shows the relationship of the non-dimensional bedload sediment transport rate q* versus the Shields parameter τ*. As shown in Fig. 3(a), an increase in w causes an increase in the critical Shields parameter τ*c. In addition, it is observed that q* tends to decrease with an increase in w when τ* is the same. However, the effect of w on q* varies according to the value of fc because the decline in q* increases with an increase in fc. A similar phenomenon is also observed in Fig. 3(b). Although a decrease in q* according to an increase in pf is small for fc = 0.1 N/m2 , it is found that a decline in q* for fc = 1.0 N/m2 is larger than that for fc = 0.1 N/m2 (see Fig. 3(b)). In Fig. 3(c), the value of τ*c increases with an increase in fc, and it is also found that q* decreases with an increase in fc for the same τ*. Furthermore, the case of τ*c0= 0.046, which is the solid green line without cohesive effects (fc = 0.0 N/m2), and the case of fc = 1.0 N/m2 and τ*c0= 0.03, which is the blue two-dot chain line, are compared based on the same critical Shields number τ*c because τ*c is about 0.046 when fc = 1.0 N/m2 and τ*c0 = 0.03. A different trend in q* is observed in spite of the same critical Shields parameter, that is, q* for fc = 1.0 N/m2 is smaller than that for non-cohesive effect consideration. This result emphasizes the importance of appropriate modeling taking into account the cohesive effects caused by the mud in sediment transport calculation because considering only the increasing effects of τ*c0 caused by the cohesive force is insufficient.
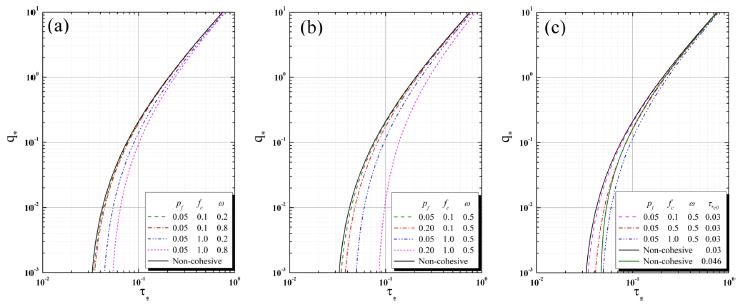
Non-dimensional bed-load sediment transport rate q* versus the Shields parameter τ* : (a) the characteristic of q* according to ω ; (b) the characteristic of q* according to pf; and (c) the characteristic of q* according to fc.
4. Characteristics of Sediment Transport Calculation Considering Cohesive Effects
The three-dimensional coupled fluid-structure-sediment interaction model developed by Nakamura et al. (2011) is briefly described in this section. The model is composed of a main solver and three modules. The main solver is a large-eddy simulation (LES) based on a continuity equation and a Navier-Stokes equation for analyzing the motion of an incompressible viscous air-water two-phase fluid including the pore fluid inside the porous media taking into account the movement of the movable structure and topographic change. The three modules are a volume-of-fluid (VOF) module based on the multi-interface advection and reconstruction solver (MARS) to track the gas-liquid interface, an immersed-boundary (IB) module based on the body-force type of IB method dealing with the movable structure, and the sediment transport module to analyze the concentration of suspended sediment transport and the topographic change associated with bed-load and suspended sediment transport. The three modules are incorporated into the main solver with a two-way coupling technique to take into account the fluid-structure-sediment interaction. Here, the proposed sediment transport calculation was applied into the sediment transport module to take into account the cohesive effects caused by mud filling in the pores of the sand particles. It should be noted that, in this study, the IB module was not included because motion of the structure was not dealt with.
5. Application of the Modified Model Considering Cohesive Effects
The modified model was applied to hydraulic experiments on the topographic change of artificial shallows consisting of fine sand (Nakamura et al., 2012a). Subsequently, a numerical simulation was carried out on the supposed condition that the pores of the sand particles contained the mud with the cohesive force, and the sensitivity analysis of the modified model was conducted focusing on the relationship between the variation of the parameters (fc, pf, ω) and topographic change of the shallow.
5.1 Numerical condition
Fig. 4 shows a schematic of a computational domain. As shown in Fig. 4, shallows (height: 20.0 cm; crown width: 200.0 cm; slope gradient: 1/20) composed of fine sand with a median grain size, d50 = 0.1 mm, was installed based on the initial topography measured in the hydraulic experiments. In addition, a wave generating source/sink was placed 140.0 cm away from the beginning of the shallow, and damping zones were installed in the offshore side of the wave generating source and the onshore side of the vertical wall. Here, the length of the damping zones was about twice as long as the incident wavelength to reduce the wave reflection from the boundaries. Regular waves were generated with a wave height Hi = 6.5 cm, a wave period T = 1.0 s, and a still water depth h = 22.50 cm. The entire domain except for the damping zones was discretized using orthogonal staggered cells with a uniform size of Δx = 2.0 cm and Δx = 0.5 cm, whereas non-uniform cells widening gradually were used in the damping zones for efficient numerical simulation. The boundary conditions were the same as in Nakamura et al. (2012b). The parameters were the porosity of fine sand m = 0.4, the density rs = 2.65×10³kg/m3, the critical Shields parameter on the horizontal plane τ*c0 = 0.03, the submerged angle of repose θr = 30.0 and the content ratio of the mud pf = 0.0 because the shallow were composed of only fine sand without mud. Other parameters were referred to in the previous section and Nakamura et al. (2011).
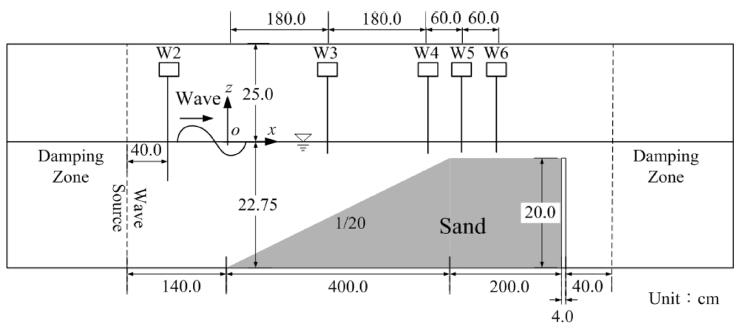
Computational domain for the topographic change of the shallow.
5.2 Effects of the Cohesive Force on the Topographic Changes of shallows
It is assumed that mud filled the pores of the sand particles forming the shallow. The cohesive resistance force per unit surface area fc, the water content ω and the content ratio of the mud pf are noted as the main parameters which lead to cohesive force, and the effects of these parameters on the topographic change of the shallow were investigated.
The effects of fc, ω and pf on the topographic change Δz at t = 60 s are shown in Fig. 5. In the figure, only Δz in the range of x = 50 − 450 cm of the whole domain was expressed because the topographic change mainly occurred on the slope of the shallow. It was confirmed from Fig. 5(a) that the amount of Δz tends to decrease with an increase in fc. Specifically, when fc was increased from 0.1 N/m2 to 1.0 N/m2 , it was observed that little deposition emerged on the location from the upper slope to the crown and little erosion appeared on the middle of the slope. This was because, as shown in Fig. 3(c), the critical Shields parameter increased and the bed-load sediment transport rate decreased with an increase in fc, and finally this sequence had the effect of decreasing Δz. In addition, although Δz decreased with an increase in ω, the distinction was very small as shown in Fig. 5(b). This was because the small value of fc, 0.1 N/m2 , was adopted on account of the little topographic change that occurred for fc = 1.0 N/m2 , and the effects of ω on the critical Shields parameter and the bedload sediment transport rate were very small when fc = 0.1 N/m2 as shown in Fig. 3(a). A similar trend to that shown in Fig. 5(b) is also observed in Fig. 5(c). Furthermore, the variation of the parameters fc, ω and pf seems to have little effect on the trend for the topographic change of the shallow. Therefore, by filling the pores of the sand particles with mud, the wave-induced topographic change of the shallow can be reduced without changing the topographic change pattern.
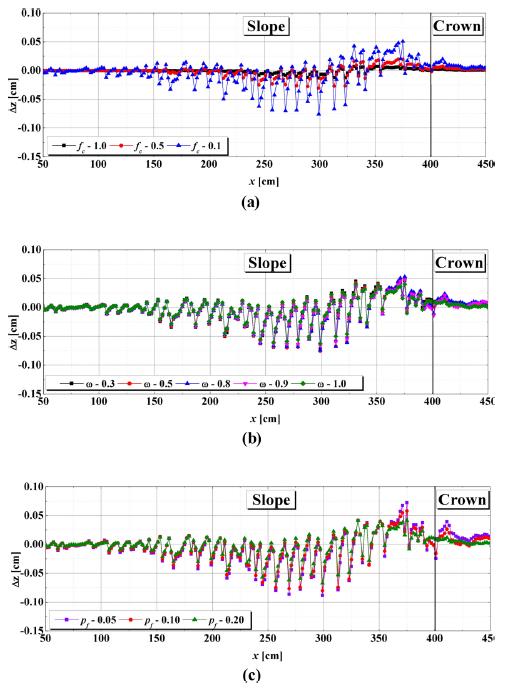
Difference in the amount of topographic change Δz caused by the cohesive force at t = 60 s: (a) the effects of the cohesive force per unit surface area (ω = 0.5, pf = 0.15); (b) the effects of the water content (pf = 0.15, fc = 0.1N/m2); (c) the effects of the content ratio of the mud (ω = 0.5, fc = 0.1N/m2).
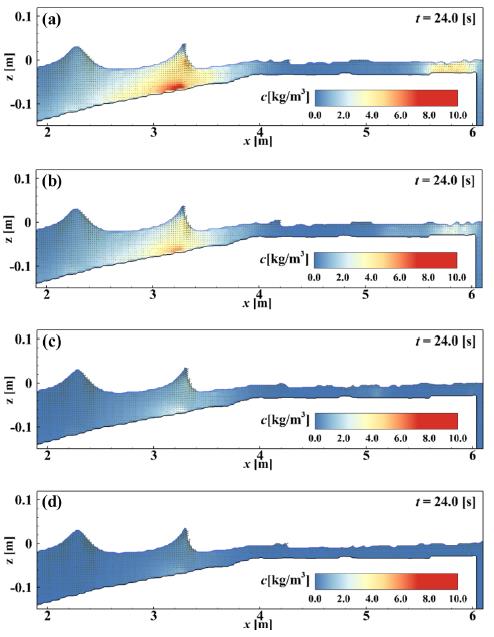
Comparison of cross-shore distribution of the suspended sediment concentration at t = 24.0: (a) with non-cohesive effect; (b) with fc = 0.1N/m2; (c) with fc= 0.5N/m2; (d) with fc= 1.0N/m2.
The snap shots of suspended sediment concentration at t = 24.0 s when suspended sediments are shown obviously are presented in Fig. 5(a)~(d). In the case of a non-cohesive effect, suspended sediments are observed on the slope of the shallow and near the wall located on the end of the shallow as shown in Fig. 5(a). However, as cohesive force increases, it is shown that the stabilized shallow is observed with low concentration of suspended sediments, in particular in the results for fc = 1.0 N/m2. The results considering cohesive effects show similar process to the case with noncohesive effects of sediment transport on the slope of the shallow that initial suspended sediments take place on the region apart from the initial point of the shallow and are entrained to the end of the slope and only apart of the entrained sediments is propagate with flow generated after wave breaking. While the difference of the trend of sediment transport process is not observed during the simulation time, the suspended sediment concentration becomes lower as cohesive effects increase.
5. Conclusions
In this study, the sediment transport calculation considering the cohesive force generated by mud filled sand particles was proposed. The numerical simulation model incorporating the proposed calculation was verified by applying it to the hydraulic experiments on the topographic change of shallows composed of fine sand, and the basic characteristics of the model were examined. In addition, the sensitivity analysis of the cohesive effects on the topographic change of the shallow were conducted. As a result, the conclusion can be summarized as follows:
1. Through the relationship between the non-dimensional bed-load sediment transport rate and Shields parameter, an increase in the cohesive resistance force per unit surface area fc, the water content ω and the content ratio of the mud pf result in an increase in the critical Shields parameter and a decrease in the bed-load sediment transport rate. Furthermore, the existence of mud in the pores of the sand particles indicates the importance of proper modeling taking into account the cohesive effects. This is because the results presented different patterns for the bed-load sediment transport rate for cases considering cohesive and non-cohesive effects, in spite of having the same critical Shields number.
2. By carrying out a sensitivity analysis on the effects of the three parameters, fc, ω and pf, on the topographic change of the shallow, it was confirmed that the topographic change was decreased with an increase in fc, ω and pf. In addition, the results show that taking into account the cohesive effects had little influence on the topographic change pattern. Consequently, the possibility of reducing topographic change by containing the mud in the sand particles with little change in its trend is suggested.
From these results, the computational capability of this proposed model for analyzing sediment transport problems involving various conditions of mixed sediments coexisting with sand and mud was confirmed. However, it is desirable to validate the proposed calculations with hydraulic experiments.
Acknowledgements
The authors are grateful for the financial support of the Steel Foundation for Environmental Protection Technology, Japan (SEPT).