Numerical Model for Predicting Sand Bar Formation around River Mouth
하구역의 사주 형성 예측을 위한 수치 모델
Article information
Abstract
A three-dimensional beach evolution model was presented to predict morphodynamics around a river mouth. The presented model was based on the depth-averaged (2DH) and quasi three-dimensional (Q-3D) nearshore current modules, and the model took into account shoreline changes, the effect of advection diffusion of suspended load and discharged sediments from the river. First, the 3D beach evolution model was applied to the formation of sand spits and terrace at the river mouth in order to investigate the performance of the model. Secondly, the model was applied to the river mouth at the Ara River, facing the Sea of Japan. The formation of sand spit at the Ara River in winter season was reproduced. The computed result showed qualitatively agreement with field site observation.
Trans Abstract
하구역의 지형변화를 예측하기 위해 3차원 해빈 변형 모델을 통한 계산이 수행되었다. 본 모델은 수심적분을 기초로 한 준 3차원 연안흐름 모듈로 구성되며, 해안선의 변화, 부유사의 이송-확산 효과를 고려할 수 있다. 우선 모델의 성능을 확인하기 위해 3차원 해빈 변화 모델이 하구역 사주 형성에 적용되었다. 다음으로 동해에 인접한 Ara 강 하구에 모델이 적용되었다. Ara 강의 사주의 동계 변화가 재현되었으며 계산결과는 현장 관측 결과와 좋은 일치를 나타냈다.
1. Introduction
The flow field around the river mouth is extremely complicated due to river discharges, waves, wave-induced currents and tidal currents of different densities, not to mention the topographical changes from the hydrodynamics are also complicated. In order to prevent flooding caused by heavy rains and to maintain the function of the river mouth, the control of river discharge and prediction of morphodynamics around river mouths are required.
Many models for predicting 3D beach evolution have been proposed (e.g. de Vriend et al., 1993, Kuroiwa et al., 2004), and applied to many practical problems, such as beach evolution due to construction of coastal structures, coastal erosion and so on. Ranasinghe et al. (1999) and Kuroiwa et al. (2008) attempted to predict the morphodynamics around the river mouth. The applicability to morphodynamics involving the formation of river-mouth bars and blockage of river mouth due to waves and nearshore currents have not been fully investigated.
The purpose of this study is to develop a 3D numerical model that can predict 3D morphodynamics around the river mouth. In this study, the previous model (Kuroiwa et al, 2008) was modified to take into account the effect of advection and diffusion of suspended load and sediments supplied from river. The model tests for the bathymetry involving the river mouth were carried out. Furthermore, the modified model was applied to the formation of river-mouth bar at the Ara River facing the Sea of Japan East Sea.
2. Numerical Model
2.1 Outline of the Model
The presented model was based on the hybrid model with 2DH and Q3D nearshore current modes presented by Kuroiwa et al. (2006). The model consists of three modules, which are computations of (1) waves, (2) nearshore currents and (3) sediment transport and water depth change as shown in Fig. 1. In the sediment transport module, the depth-averaged advection diffusion equation for suspended load was adapted.
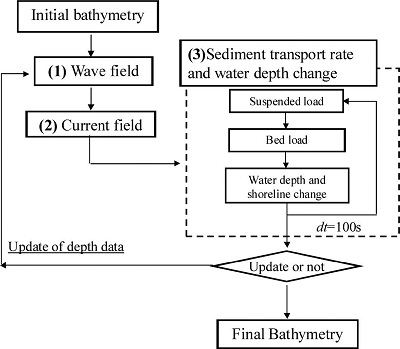
Flowchart of the presented model.
2.2 Wave and Nearshore Current Models
The wave field is determined by the energy balance equation presented by Mase (2001). The nearshore current field is determined by the depth-averaged mode or quasi-3D (Q-3D) mode in the hybrid model, according to wave condition and prediction period. In stormy wave conditions, the Q-3D mode was used to consider the effect of undertow in the surf zone.
2.3 Sediment Transport and Water Depth Change
The total sediment transport rate is defined as the sum of bed load and suspended load. The water depth and shoreline changes were computed by the continuity equation as follows:
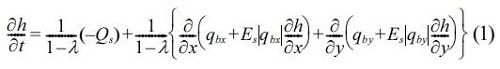
where h is the water depth, Es is the dimensionless coefficient. qbx and qby are the bed loads, which are estimated based on Watanabe et al.(1985). The bed loads are given by

 is due to wave orbital velocities at bottom.
  is due to steady currents. These are estimated by
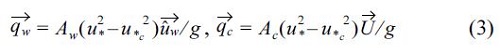
where Aw and Ac are dimensionless coefficients, u* is the friction velocity, is the critical friction velocity, u*c is the steady current vector with river flow. In case the Q3D mode use, the bed load due to neashore current velocities at sea bottom is determined. The coefficients Aw and Ac are given by a function of the median diameter d50 (Shimizu et al., 1996).
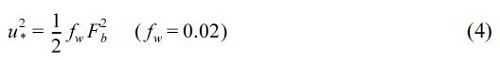
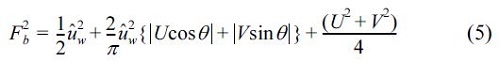
In this study, the friction velocity presented by Sawaragi et al. (1985) is used to consider the river flow:
Qs is the difference between the upward sediment flux Fz and the down ward flux wfC, which is proposed by Sawaragi et al. (1985), and given by

The upward sediment flux Fz is determined by
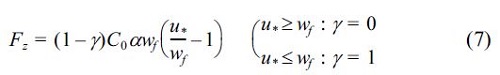
where a(0≤a≤1.0) is the dimensionless coefficient, C0 is the concentration at reference point (Sawaragi et al., 1983). The concentration of suspended load C is determined by solving the depth-averaged advection diffusion equation, as given by

where U and V are the depth-averaged current velocities. εx and εy are the diffusion coefficients, given by 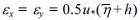 .
.
In this model, the sediment transport rate in the run-up region is taken into account in order to predict the shoreline changes.
3. Model Tests for Formation of Sand Bar
3.1 Topographic Features around River Mouth
Topographic features around river mouths are roughly classified into three types by Sawaragi (1995). In a wave dominating type (Type A), symmetric and asymmetric bars are formed under normal wave conditions. In a river flow dominating type (Type B), deltas and terraces are formed in front of the river mouth. A longshore bar is formed under an extreme wave condition (Type A). In a tidal current dominating type (Type C), sand bars are formed in the river under high tide and high wave conditions. Fig. 2 illustrates typical topographic patterns associated with the topographic features of types (A) and (B). As shown in Fig. 2 (a) and (b), river-mouth bars such as sand spits occur in river mouths connecting to sea areas with low tidal range mainly due to wave action. If the river discharge is small, then the river mouth closes.
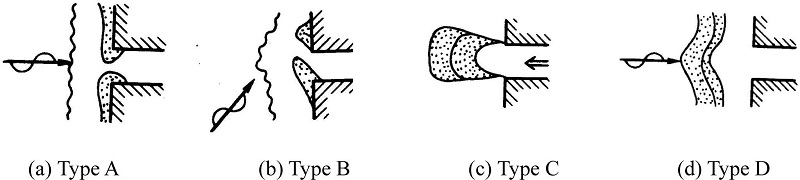
Typical topographic patterns around a river mouth: (a) river-mouth bars, (b) asymmetric river-mouth bar (sand spit), (c) terrace and (d) longshore bar.
3.1 Model Setup
In this model test, the waves, nearshore currents with river flow and river-mouth bar formations were computed in the idealized bathymetry with a river mouth, as shown in Fig. 3, in order to examine the numerical model performance against several cases. The computational domain covered an area of 700 m × 500 m, with a grid interval of 10 m; and the gradient of beach slope was set to 1/50. The computations of 5 cases as shown in Table 1 were carried out. In CASE 1, 2, 3 and 4, normal wave condition was used and then steady current field was computed using 2DH mode. In CASE 4, in order to investigate the influence of discharged sediment from river mouth, the concentration of sediment at the up-stream boundary at x = 700 m was charged. In the case of normal wave condition, bathymetry after 40 days was computed. The computations of the wave and nearshore current were carried out every 2 days to obtain the final bathymetry, namely the number of feedback into the hydrodynamic computation was set to 20. Table 1 lists dimensionless coefficients εs, Cw and α, associated with the sediment transport. In CASE 5, Q3D mode, which is three-dimensional computational mode, was used in order to perform formation of offshore sand bar as shown in Fig. 2 (d). The final bathymetry after 2 days was simulated. The computations of wave and nearshore current models were carried out twice a day.
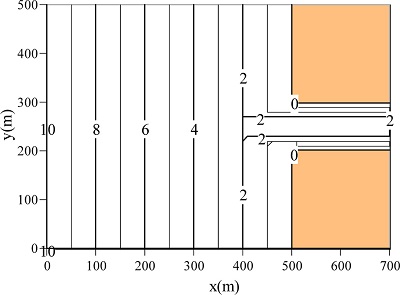
Computational domain and bathymetry.

Wave conditions and dimensionless coefficients for each case
3.2 Computed Results
3.2.1 Wave Dominating Type without River Flow
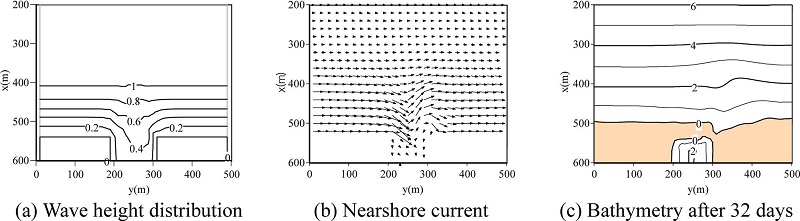
Fig. 4 shows computed wave and nearshore current fields against the initial bathymetry, and bathymetry after 40 days, for Case 1. As can be seen, a symmetric circulation pattern in front of the river mouth was computed, and then sand spits on both sides of the river mouth were reproduced. The width of the channel at the river mouth became narrow. Fig. 5 shows computed results under oblique incident wave for Case 5. From this figure, longshore current was computed and a sand spit was gradually reproduced, and then blockage of river mouth occurred after 36 days. These computed results indicate that the presented model might be able to predict the formation of sand spit and the blockage of a river mouth.

Computed results for Case 1.
Computed results for Case 2.
3.2.2 Wave Dominating Type with River Flow
Figs. 6(a) and (b) show computed steady current field and bathymetry with river flow of 0.2m/s for Case 3. Sediment was not trapped at the river mouth as can bee seen from the results. Therefore, the magnitude of sand spit at the river mouth became smaller than that in Case 2. A terrace in front of the river mouth was reproduced due to river flow. Fig. 7(a) and (b) show the computed bathymetries with the consideration of discharged sediment concentration of C = 0.00035 and C = 0.001, respectively. The sediment concentration C at the up-stream boundary (x = 700m) was set. We found that the contour line of 2m in the case of C = 0.001 differs from that in the case of C = 0.00035. The contour line of 2m in Fig. 7(b) was advanced, and then the terrace for C = 0.001 is larger than that for C = 0.00035. These computed results are due to the effect of suspended sediment transport computed by advection and diffusion model.

Computed results for Case 3.
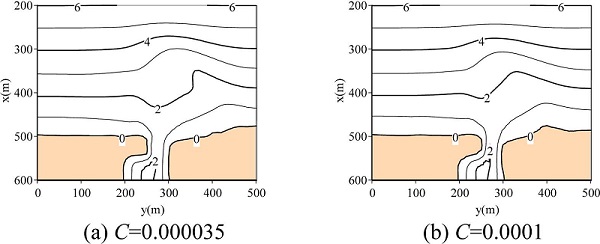
Computed bathymetries after 40 days with discharged sediment at up-stream boundary (Case 4).
3.2.3 Wave Dominating Type under Stormy Wave
In the case of stormy wave condition, offshore sand bar is formed (Fig. 2(d)). Therefore, to reproduce such sand bar, the Q-3D module, which takes into account undertow in the surf zone, is required. Figs. 8(a), (b) and (c) show computed wave height distribution, current vectors at mean water surface and bottom, respectively. From Figs. 8(b) and (c), we found that the direction of current vectors at mean water surface is slightly shore-wards, on the other hand, the current vector at bottom is offshore-wards. Fig. 9 shows computed bathymetries and cross-shore profiles. A sand spit was developed and the steep slope between 4 m and 6 m was reproduced as can be seen in Figs. 9(a) and (b). Furthermore, Fig. 9(c) confirmed that offshore sand bar was reproduced. Not only the longshore current but also undertow was generated under stormy wave condition. Consequently, sand bar was reproduced by undertow effect. This computed result qualitatively agree with the sand bar formation as shown in Fig. 2(d).
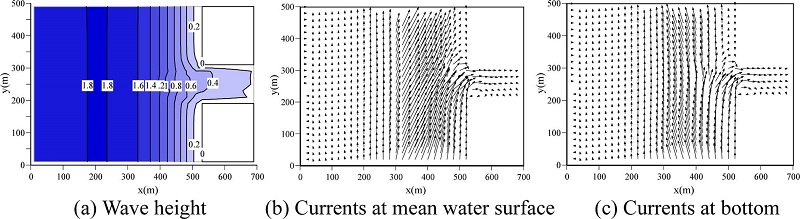
Wave height distribution and nearshore current under stormy wave condition (Case 5).
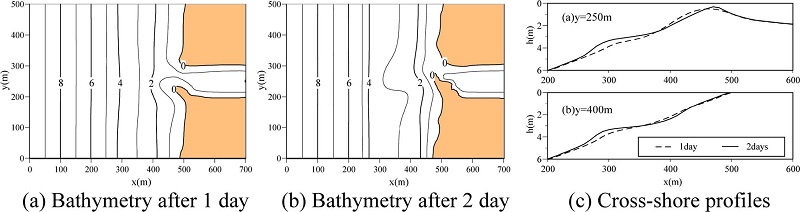
Computed Bathymetries and cross-shore profiles under stormy wave (Case 5).
4. Field Verification
4.1 Field Site
The Ara River is located in Niigata Prefecture, facing the East Sea. Figs. 10(a) and (b) show aerial photos taken in 1985 and 2002, respectively. A sand spit at the river mouth was seen in 1985. In 1985, a jetty on the left bank side and groins on the right bank side were constructed. After the construction of the groins on the right bank side, the width of the sand spit became smaller by interruption of alongshore sediment transport. The median diameter d50 around the sand spit was 0.5 mm. The dominating direction of incident wave during winter season is NNW. Therefore, the alongshore sediment transport is contributed from the right hand side of the Ara River.
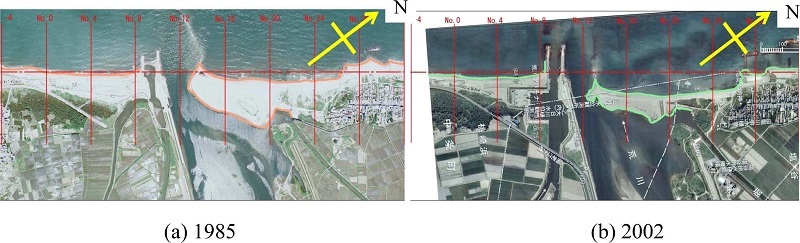
Aeal photo saround the Ara River 1985 and 2002.
4.2 Model Setup
In this study, a simulation of formation of the sand spit as seen in 1985 was attempted. Because of the lack of a detailed bathymetry data, however, a modeled bathymetry as shown in Fig. 11 was prepared to investigate the model applicability. Kuroiwa et al.(2008) have simulated a sand bar formation without coastal structures. The simulation results confirmed that winter waves contributed the formation of the sand bar. Therefore, morphological change during winter season was computed. The wave height and period used in this simulation were 2.4 m and 7.6 s, respectively, which are energy-averaged values during winter period from Dec. to Feb., except for the wave height less than 1 m. Wave direction of NNW was set. The total period of wave action was set to 70 days. To obtain the bathymetry after 70 days, the computation of hydrodynamic modules was carried out every 10 days. 2DH mode was used in the nearshore current computation.

Initial Bathymetry.
4.3 Computed Results
Figs. 12(a) and (b) show computed wave height distribution and the depth-averaged nearshore current field, corresponding to the initial bathymetry as shown in Fig. 11. Fig. 13 shows computed bathymetries after 20, 30, 60 and 70 days. As can be seen from these computed bathymetries, a small sand spit first was formed after 20 days and it was grown with time, then the sand spit almost reached to the left bank of the Ara River, finally the width of channel at the river mouth became narrow. Although this computed result qualitatively agrees with the actual sand bar shape in 1985, the direction of the computed sand spit is slightly different from the one in 1985 as shown in Fig. 10.
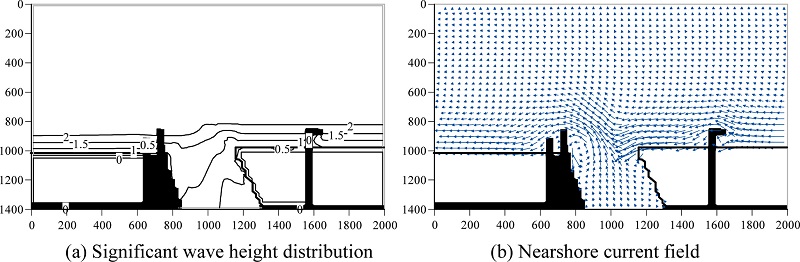
Computed results at initial bathymetry.
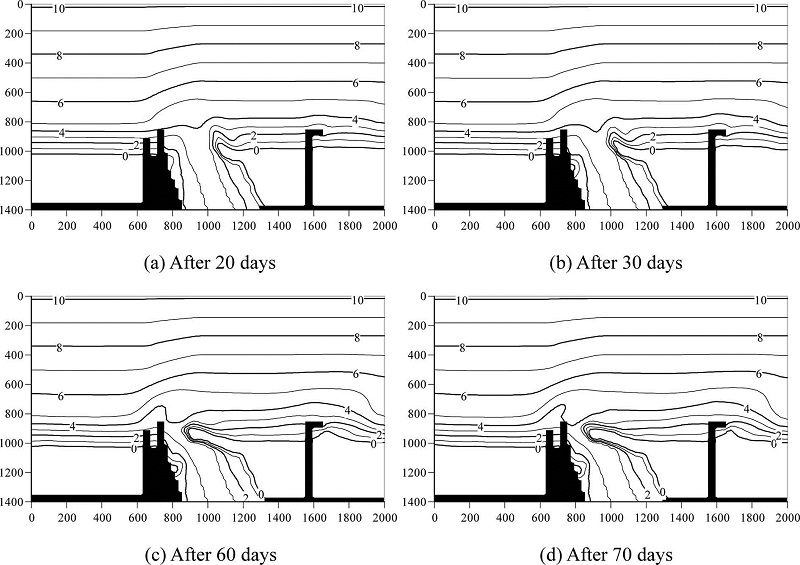
Computed bathymetries around the ArRiver.
5. Conclusions
In this study, a three-dimensional numerical model for predicting morphodynamics around a river mouth was presented. In this presented model, the advection and diffusion of suspended load and discharged sediment from river were considered using the depth-averaged advection diffusion equation. Furthermore, according to wave condition, 2DH or Q3D hydrodynamic model was used.
Firstly, the presented model was applied to a model bathymetry with river mouth in order to investigate the performance of the numerical model.
• Wave dominating type without river flow
2DH model was used under normal wave condition, which reproduced remarkable river-mouth bar. In the case of oblique incident wave, a sand spit was grown and then the blockage of river mouth was occurred. On the contrary, Q3D hydrodynamic model was used under stormy wave condition. Not only sand spit at river mouth but also offshore sand bar was developed. We confirmed that the offshore sand bar was formed by undertow effect.
• Wave dominating type with river flow
The blockage did not occur under normal wave condition although river-mouth bar was reproduced. Instead, a terrace in front of the river mouth was reproduced. Furthermore, by considering the discharged sediment from river, the deposition of the discharged sediment became larger and then the depth contour in front of the river mouth was advanced.
Secondly, the model was applied to a river-mouth bar formation at the Ara River, facing the East Sea. The river-mouth formation under winter wave condition was simulated. The results suggest that a sand spit was grown with time, the computed sand spit was qualitatively similar shape to field site one.
Acknowledgements
We would like to acknowledge the Haetsu Office, Hokuriku Regional Development Bureau, the Ministry of Land, Infrastructure, Transport and Tourism, for providing some aerial photos and wave data.